Why Industry-Specific Cost Matters in Facebook Advertising
Not all Facebook Ads are created equal. Depending on your industry, your cost-per-click (CPC) and cost-per-action (CPA) can vary dramatically.
Understanding these averages helps you:
- Set realistic budgets
- Benchmark performance
- Avoid overspending in the wrong places
- Adjust strategy for higher ROI
Let’s break down the average Facebook Ad costs by industry in 2025—and what you can do to optimize spend.
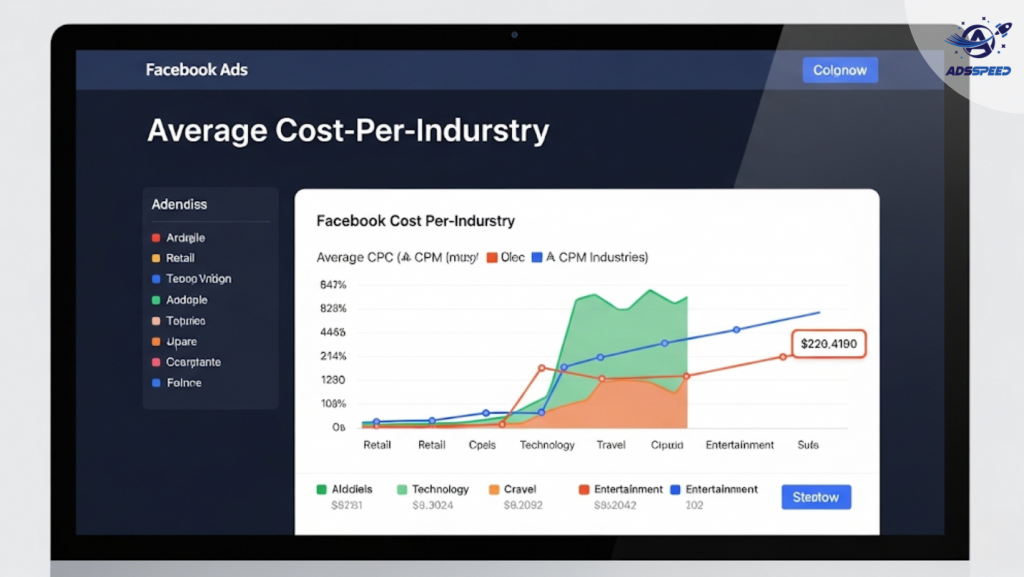
Average Facebook Ad Costs by Industry (2025 Estimates)
| Industry | Avg. CPC | Avg. CPA |
| E-commerce | $0.70 | $22–$45 |
| Real Estate | $1.35 | $40–$90 |
| Education | $0.90 | $25–$55 |
| Fitness & Wellness | $0.80 | $30–$70 |
| SaaS / B2B Software | $1.60 | $60–$150 |
| Legal Services | $1.80 | $80–$200 |
| Beauty & Cosmetics | $0.65 | $20–$50 |
| Finance / Insurance | $1.75 | $80–$160 |
| Travel & Hospitality | $0.95 | $30–$70 |
| Healthcare | $1.40 | $45–$100 |
Note: These are global averages and can fluctuate based on location, audience size, ad quality, and competition.
What Influences These Costs?
Facebook ad pricing is based on an auction system, so the more advertisers bidding on the same audience, the higher the cost.
Key factors:
- Audience saturation
- Ad relevance score
- Seasonal demand (e.g., Q4 retail surge)
- Conversion goal complexity (e.g., “Add to cart” vs. “Book consultation”)
Using optimization tools like Adsspeed allows advertisers to track cost by region, campaign, and objective—helping you stay efficient even in expensive verticals.
Industry Benchmarks vs. Strategy
You may pay above average—but still be profitable.
Example:
- A B2B software company paying $150 per lead is normal—if each lead has high lifetime value (LTV).
- A beauty brand may thrive with $0.60 CPC—but needs volume to scale.
Don’t just look at cost—look at ROI.
How to Reduce Facebook Ad Costs (Regardless of Industry)
Improve ad relevance (engaging copy, strong creative)
Test narrow vs. broad targeting
Use retargeting to convert warm audiences cheaper
Run ads during off-peak times (early morning, weekdays)
Monitor creative performance regularly with ads check speed to avoid wasting spend on slow or broken creatives
Final Thoughts
Industry averages give you a starting point—but success depends on how smartly you spend.
Use this data to:
- Budget smarter
- Set better expectations
- Track improvements over time
Whether you’re scaling a beauty brand or running B2B campaigns, tools like Adsspeed help manage costs, test creatives, and optimize globally—all from one clean dashboard.
🔹 Google Chrome Store: Search “Ads Check Speed | adsspeed.com”
https://chromewebstore.google.com/detail/ads-check-speed-adsspeedc/bhfahbbgppclfpeapkaebjbcffjnahcd
🔹 IOS Download : https://apps.apple.com/vn/app/adscheckspeed/id6742325139
🔹 Android Download : https://play.google.com/store/apps/details?id=com.dev.fbadsspeedv2&hl=vi