
Why Measuring by Market Matters
If you’re running Facebook Ads globally or in different regions, looking at overall performance isn’t enough.
What works in the U.S. may flop in Vietnam.
🇫🇷 A successful French campaign might underperform in Canada.
That’s why it’s essential to measure performance by market—so you can:
- Allocate budget more wisely
- Adjust creatives for local audiences
- Find high-performing regions to scale
- Cut wasted spend in underperforming areas
1. Set Clear Regional KPIs
Before measuring success, define what success looks like—per market.
Examples:
- In the U.S.: Focus on ROAS (Return on Ad Spend)
- In Brazil: Focus on reach and brand awareness
- In Germany: Prioritize lead quality and form completions
- In Southeast Asia: Emphasize video views and engagement
Tailor your goals to each region’s stage in your funnel and audience behavior.
2. Segment Campaigns by Location
Use Facebook Ads Manager to split campaigns or ad sets by country or region.
This makes it easier to:
- Track cost per result (CPC, CPA, CPL)
- Monitor ad frequency per region
- Adjust bids and budgets per performance
- Test localized creatives
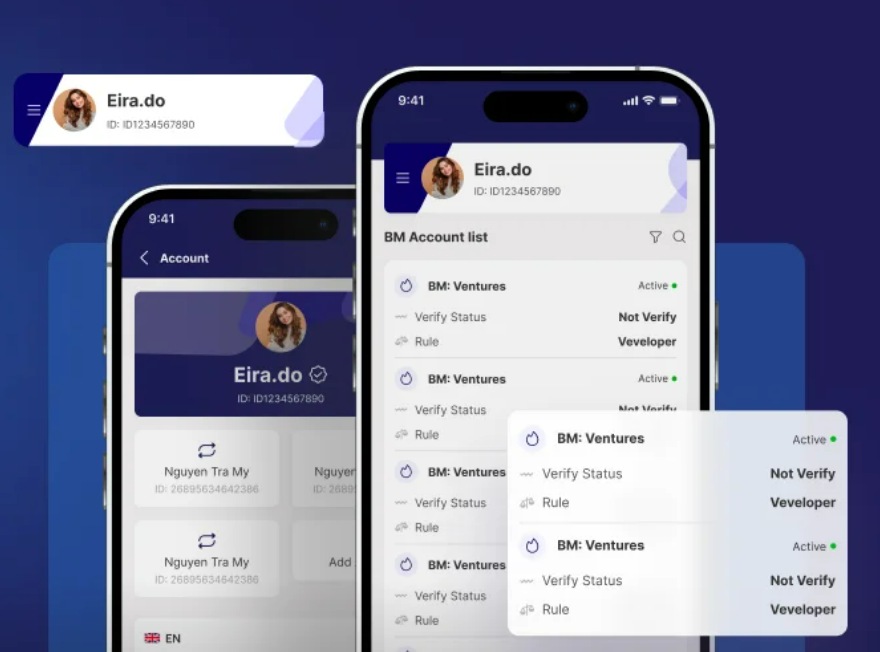
If you’re managing many regions, platforms like Adsspeed help you view all campaign metrics by market in one centralized dashboard—no switching tabs endlessly.
3. Key Metrics to Compare by Market
Here’s what to monitor:
| Metric | Why It Matters |
| CPM (Cost per 1,000 impressions) | Helps compare ad costs across regions |
| CTR (Click-through rate) | Indicates ad creative relevance |
| CPC (Cost per click) | Shows how efficiently your ad drives traffic |
| CPA (Cost per action) | Measures conversion cost in each market |
| Frequency | Avoids overexposure in smaller regions |
| ROAS | Most critical for eCommerce campaigns |
Be cautious: a low CPC doesn’t always mean success if conversions are weak. Look at cost per result AND quality of that result.
4. Local Behavior = Local Strategy
Cultural, economic, and behavioral factors affect ad performance.
Example:
- In Japan: Users value brand trust and often need more touchpoints
- In India: Low-cost offers and video explainers perform better
- In the UK: Clean, informative copy outperforms hypey language
Always test local creatives, CTAs, and messaging tailored to each market.
5. Use Benchmarks, But Make Them Flexible
Do not expect identical numbers across every market. Use regional benchmarks as a starting point.
Track trends like:
- Cost stability (Is CPC rising in a market?)
- Engagement shifts (Are users commenting more or less?)
- Funnel drop-off points (Where are users bouncing?)
Use this data to reallocate budget dynamically to your top-performing regions.
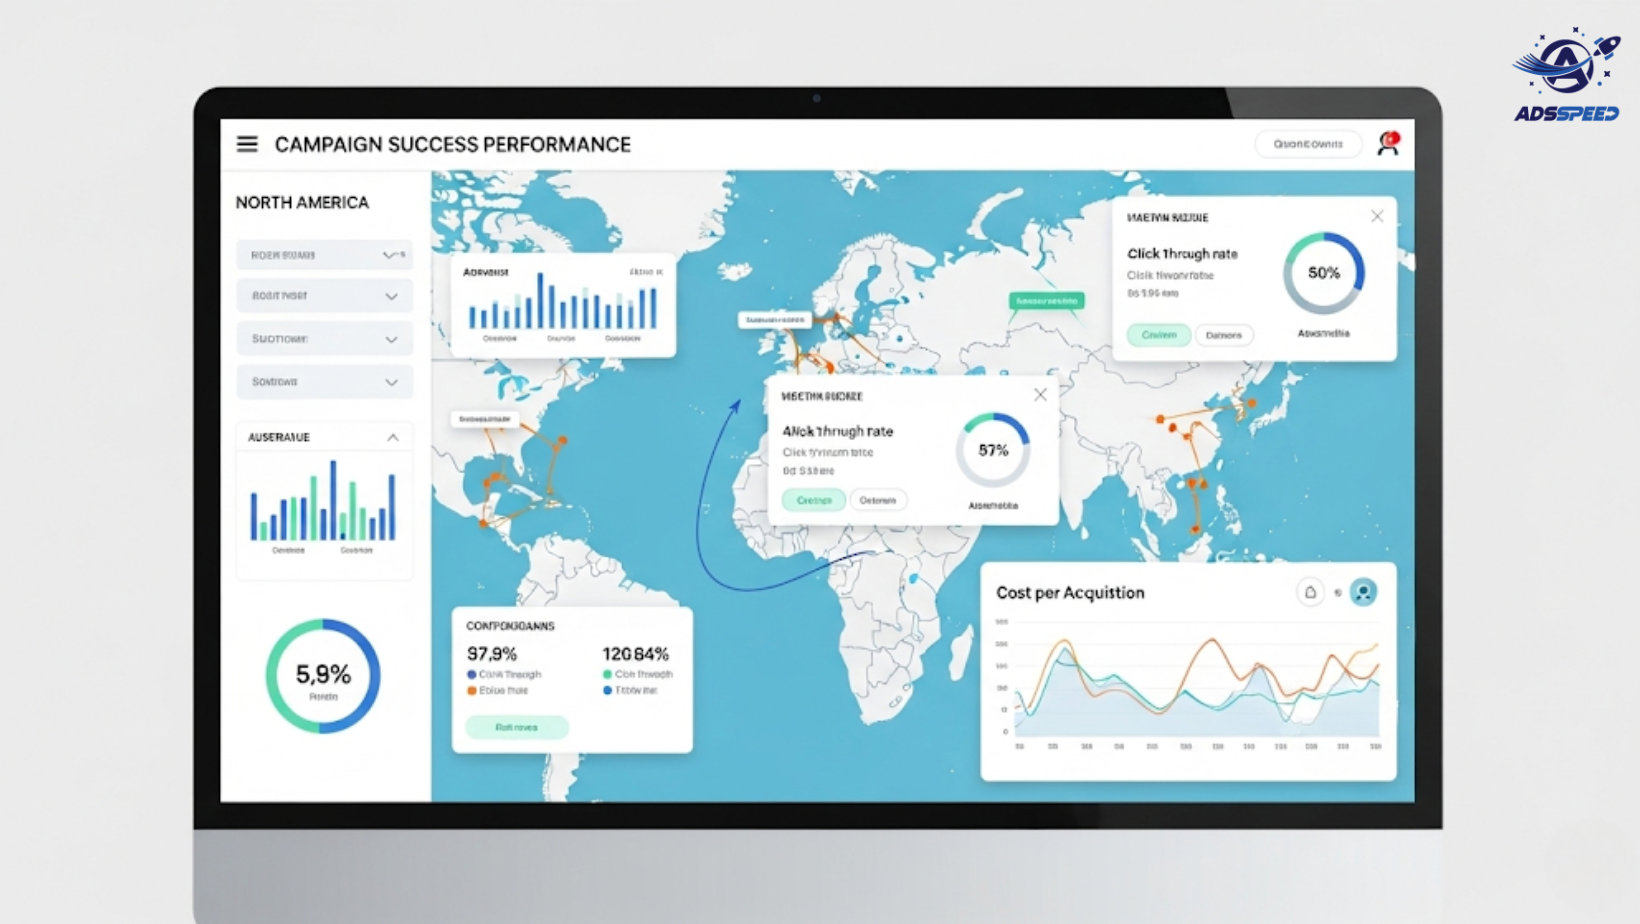
6. Visualize Results by Market
If you’re running campaigns in 5+ countries, dashboards are your best friend.
With tools like Adsspeed, you can:
- Monitor key KPIs across multiple regions
- Spot underperforming areas instantly
- Share region-specific reports with your team or clients
- Set alerts when specific market costs spike
This helps you stay agile, even across time zones.
🔹 Google Chrome Store: Search “Ads Check Speed | adsspeed.com”
https://chromewebstore.google.com/detail/ads-check-speed-adsspeedc/bhfahbbgppclfpeapkaebjbcffjnahcd
🔹 IOS Download : https://apps.apple.com/vn/app/adscheckspeed/id6742325139
🔹 Android Download : https://play.google.com/store/apps/details?id=com.dev.fbadsspeedv2&hl=vi
Final Thoughts
Measuring success by market is the key to scaling Facebook Ads globally without wasting budget.
Set region-based KPIs
Segment and compare by country
Watch the right metrics (not just CPC)
Adapt based on cultural behavior
Visualize and automate reporting when possible
When you treat each market like its own business unit, you unlock smarter growth, stronger relevance, and higher returns.