
What Are Heatmaps in Facebook Advertising?
Heatmaps are visual tools that show where users interact most with your content—by tracking clicks, scrolls, and hovers. While heatmaps aren’t a native feature of Facebook Ads, they are powerful when used in combination with your landing pages, Instant Experiences, or even video ad playback behavior.
They help answer key performance questions like:
- Where do users click most?
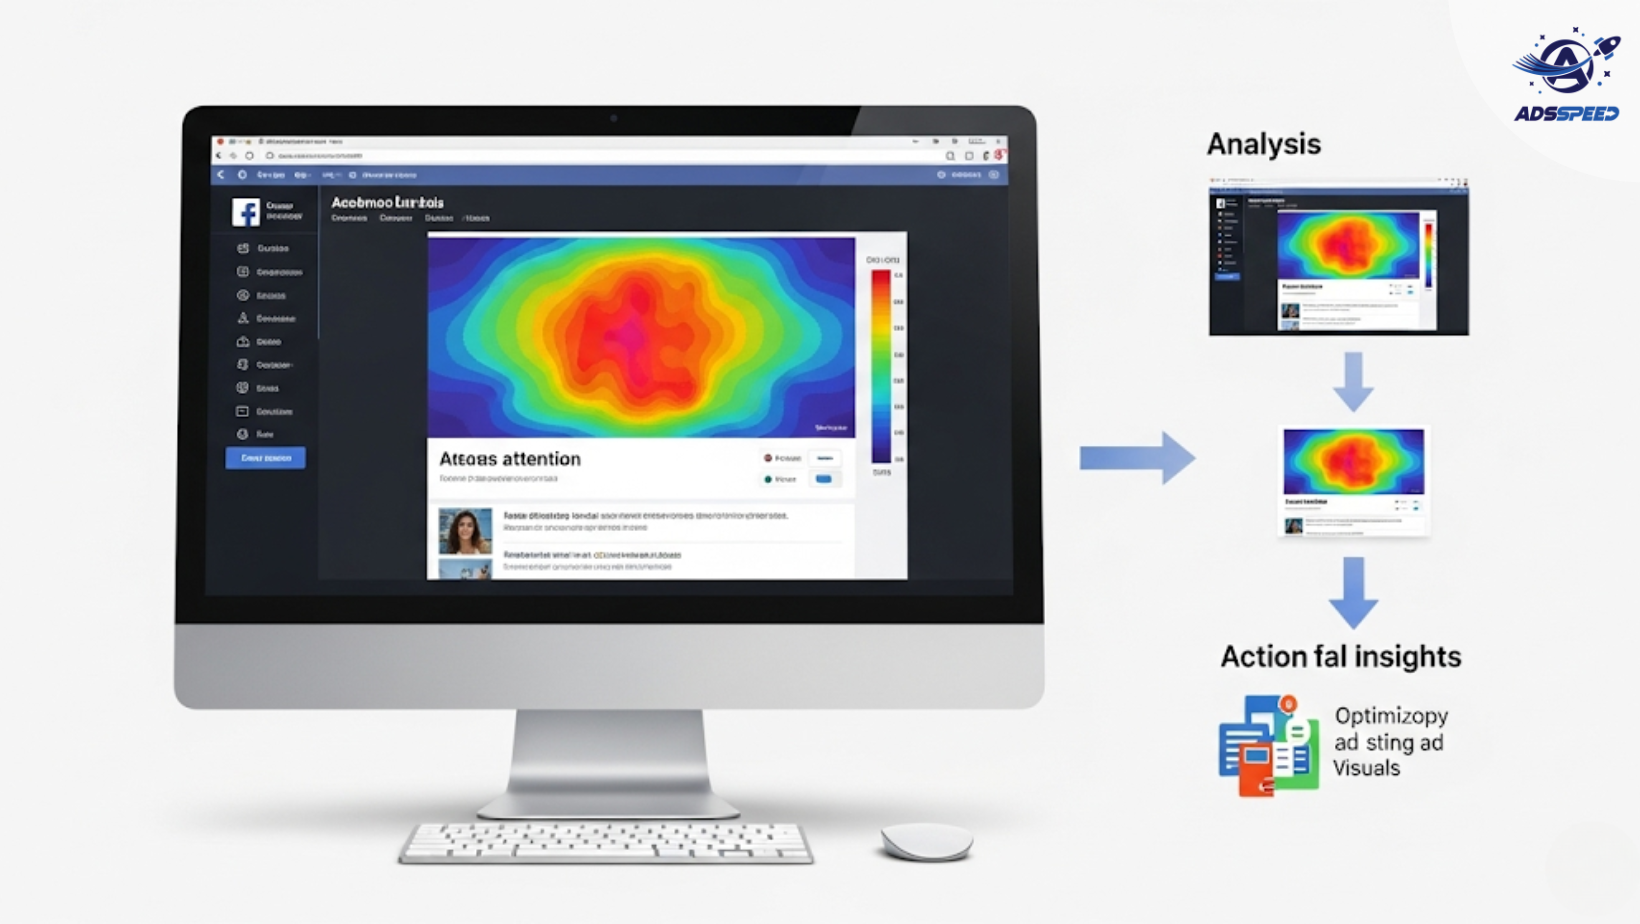
- What part of the creative grabs attention?
- Where are users dropping off?
Why Use Heatmaps with Facebook Ads?
Heatmaps give context behind your ad performance data. Metrics like CTR or bounce rate tell what happened. Heatmaps help you understand why it happened.
With heatmaps, you can:
- See how users interact with your landing page after clicking an ad
- Identify dead zones in creatives or CTAs that get ignored
- Optimize ad placement for higher engagement and conversions
- Refine your A/B testing strategies with visual data
Where to Use Heatmaps in the Ad Funnel
1. Landing Pages
After someone clicks your Facebook Ad, their experience on the landing page is critical. Heatmaps help improve:
- CTA placement
- Button visibility
- Mobile vs. desktop interaction differences
- Content engagement (which sections get skipped or lingered on)
Use tools like Hotjar, Crazy Egg, or Clarity to generate heatmaps for your high-traffic landing pages.
2. Instant Experiences
For Facebook Instant Experiences (full-screen mobile ads), some platforms can record user scroll and tap behavior, which acts like an interactive heatmap.
This helps you:
- Reorder content blocks
- Identify where viewers exit the ad
- Test alternative flows or offers
3. Video Ads (Playback Heatmaps)
On platforms like Meta for Creators and some video analytics tools, you can see viewer drop-off points. This functions like a time-based heatmap, showing:
- Which sections keep users engaged
- Where engagement drops (bad hook, too long?)
- Best time to place CTAs or brand mentions
How to Act on Heatmap Insights
Once you’ve gathered data:
Move your CTA to a high-attention zone
Shorten or simplify ignored content blocks
Test contrasting colors for key buttons
Adjust mobile versions based on touch activity
Reframe headlines that get low hover or attention rates
Over time, this iterative improvement can significantly lower bounce rates and increase ROAS.
Pro Tip: Combine Heatmaps with Ad Management Tools
Managing dozens of ads across pages and creatives? Tools like Adsspeed can help centralize performance tracking, while heatmaps reveal deeper user behavior—especially for pages you manage externally or at scale.
Using both ensures you’re not just optimizing for clicks but conversions and experience.
Final Thoughts
Heatmaps bring visual clarity to your Facebook Ads strategy. While Facebook gives the numbers, heatmaps show the story behind those numbers.
Integrate heatmap tools into your optimization workflow, especially for landing pages and video creatives. Combined with smart ad management using tools like ads check speed or Adsspeed, you’ll uncover hidden conversion opportunities others miss.
🔹 Google Chrome Store: Search “Ads Check Speed | adsspeed.com”
https://chromewebstore.google.com/detail/ads-check-speed-adsspeedc/bhfahbbgppclfpeapkaebjbcffjnahcd
🔹 IOS Download : https://apps.apple.com/vn/app/adscheckspeed/id6742325139
🔹 Android Download : https://play.google.com/store/apps/details?id=com.dev.fbadsspeedv2&hl=vi